Data Analytics Companies Overview

What is Data analytics?
If you go by the formal definition of Data Analytics (DA), it is the science of examining raw data to be able to draw the right conclusions and empower humans to make better decisions.
Data analytics is leveraged in almost every industry to help enterprises make well informed and better business decisions. The findings from examining raw data help to discover hidden patterns, market trends, correlations, affinities, customer preferences and a lot more information that is very useful to drive businesses, operations and overall efficiency.
The simple goal of data analytics is to facilitate enterprises to make more informed business critical decisions. The Data scientists together with analytics professionals and predictive modelers help in performing the analysis of large sets of data by leveraging sophisticated big data tools along with their expertise.
What is Data science?
By definition Data Science (DS) is an interdisciplinary area of study which deals with various techniques, processes and systems to derive in-depth and meaningful insights from larger volumes of structured or unstructured data.
Data science makes use of techniques and theories from multiple fields such as statistics, probability models, signal processing, machine learning & Artificial Intelligence, predictive analysis, mathematics, information technology, computer science, pattern recognition & learning, data warehousing, visualization, and high performance computing. Particularly the development of machine learning has enhanced the growth and importance of data science.
The goal of Data Science is also similar to that of Data Analytics. Data Science uses data, statistics, machine learning and predictive modeling to explore tribulations in various domains such as marketing, fraud detection, risk management, optimization etc. It emphasizes the use of mathematical and statistical methods like machine learning that apply easily without changes to various domains.
What is Business Intelligence data analytics?
A formal definition of Business Intelligence (BI): It is a technology-driven technique to analyze data and output information based on which many actions can be taken that help particularly business managers, consultants, executives, and other types of end users take better and informed business outcomes.
Business Intelligence includes a number of tools, methodologies and applications which help enterprises collate large data in diverse formats from multiple sources. All this data can be used for analysis and creation of reports or dashboards to present results in a very easy to understand format to all decision makers. BI when combined with Analytics processes such as data mining, predictive analytics, predictive modeling can drive business value to greater heights.
The goal of BI is easy interpretation of large volumes of data, providing greater insights, and identifying new opportunities that can provide businesses with a greater competitive advantage. A conventional issue is generating different types of reports for different users based on need and rights to access. When combined with Analytics, BI has proven to be extremely useful to many organizations in the decision making process.
Data analytics Vendors worldwide
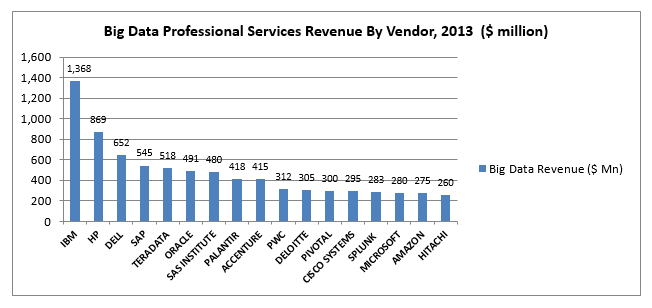
Wikibon is the first online and one of the largest technology research and advisory firm. According to Wikibon’s research and studies, the Big Data market measured by vendor revenue was $18.6 billion in the year 2013 which implies a growth rate of 58% compared to the last year. IBM topped the list with revenue of $1,368 million followed by HP with $ 869 million and Dell with $ 652 million.
Wikibon gives a clear picture of the Big Data Data Analytics Companies Vendor-wise Revenues as of 2013 below:
Advanced analytics Decision engineering
Decision Engineering is also termed as Decision Intelligence (DI) by some companies. It is a part of advanced analytics and is the right combination of both automated as well as manual decision making processes for organizations, contributing to a common methodology that removes or eliminates barriers between analytics tools / quantitative analysis and those with a more qualitative or management oriented focus. It is a highly organized framework that combines best practices for structured and easier organizational decision making process. The decision making process could be highly effective and improved with such a structured approach. The design aspect of decision engineering finds its roots in conceptual illustration technologies such as conceptual graphs, semantic networks, and mind mapping, A business decision map can be considered as one method to an official decision language in order to support the science of decision engineering.
How data analytics companies, spot bottlenecks?
Analytics companies make extensive use of sophisticated analytical tools and processes to uncover operational weaknesses, spot bottlenecks, and optimize performance. With the increase in adoption and utilization of cloud architecture and open source software, deriving valuable insights from big data has become effortless. Due to a varying demand of utilization for various resources within the cloud environment there are some resources that are used more compared to others, leading to performance issues and inefficiencies. Due to this high demand and high utilization such resources are called bottleneck resources. If companies apply performance modeling using various analytical tools they will easily be able to identify such bottlenecks.
Marketing solutions in terms of visualization
Most big data management consulting services companies utilize visualizations that help to add the important elements of context and narration to data and help to tell a story better. Visualizations make invisible data clearly visible in a comprehensive and graphical manner. The idea behind a visual is to enhance intuitive thoughts, induce reasoning, and generation of patterns just by looking at it.
Today the Market offers more than hundred visualization tools to create charts, reports, dashboards, in order to manage huge voluminous data sets easily and quickly. There are drag-and drop tools as well as plug-ins and widgets to JS, involving developers to work on open source or a tool that may come with a cost.
The relatively new Data visualization technology lets Manager/decision Makers as well as other end users view data to better understand the bigger picture with the right context. Data visualization are a narrative element of data, it’s a great way for a business to spread its story.

